Best Solutions And Individuals#
This section displays the best solution found and the best individual of each generation for each experiment within a given round. The goal is to provide a detailed overview of how the algorithm evolved across generations and which individuals contributed most to the final optimization result.
Note
The number of generations configured in the navbar determines the vertical length of each experiment log. For example, in a round with 20 generations and 3 experiments, the system will present 3 blocks (one for each experiment) listing the best individual at each generation step and the best solution reached in that experiment.
Individual Representation#
Each individual is represented as a vector. The length and interpretation of this vector depend on the dimensionality of the objective function:
Two-variable functions (e.g., f(x, y)): Each individual is naturally represented as a vector with two components, [x_val, y_val], both of which are meaningful inputs for evaluation.
One-variable functions (e.g., f(x)): To maintain internal consistency, the algorithm transforms the function into a two-variable form by mirroring the expression, as implemented in the method get_function. This transformation ensures that both components of the vector contribute meaningfully to the fitness evaluation.
def get_function(self, func_str):
    x, y = sp.symbols('x y')
    func = sp.sympify(func_str)
    if len(func.free_symbols) == 1 and x in func.free_symbols:
        func = func + func.subs(x, y)
    return func, x, y
This ensures that the evaluation of an individual [a, b] in a single-variable function f(x) becomes f(a) + f(b), effectively simulating a symmetrical 2D problem without losing generality or requiring code branching for different dimensionalities.
Visualization Layout#
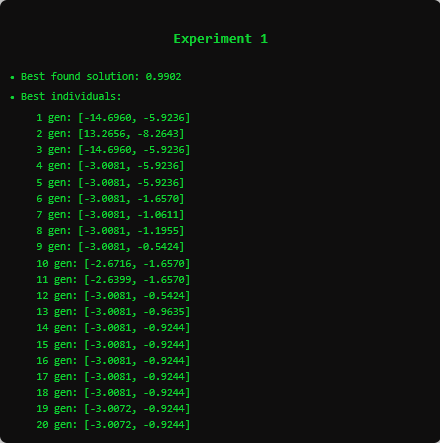
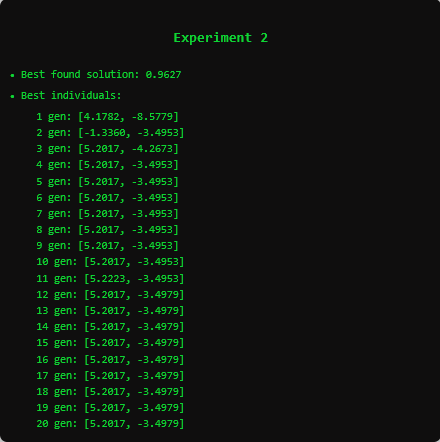
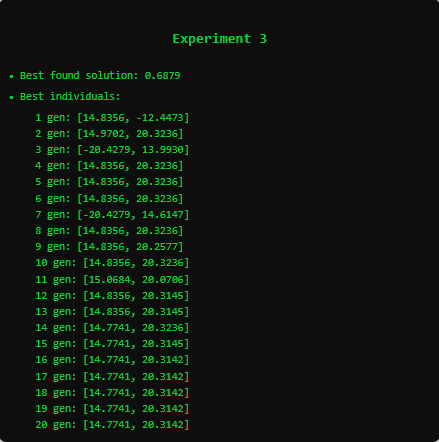
Each experiment’s output is structured as follows:
The best solution found across all generations in the experiment.
A list of the best individual at each generation, indicating the genotype (vector of variables) of the most fit candidate at that point in evolution.
This output is particularly useful for:
Understanding convergence behavior within each experiment.
Verifying the consistency of best individuals over time.
Detecting patterns of stagnation or sudden improvements.
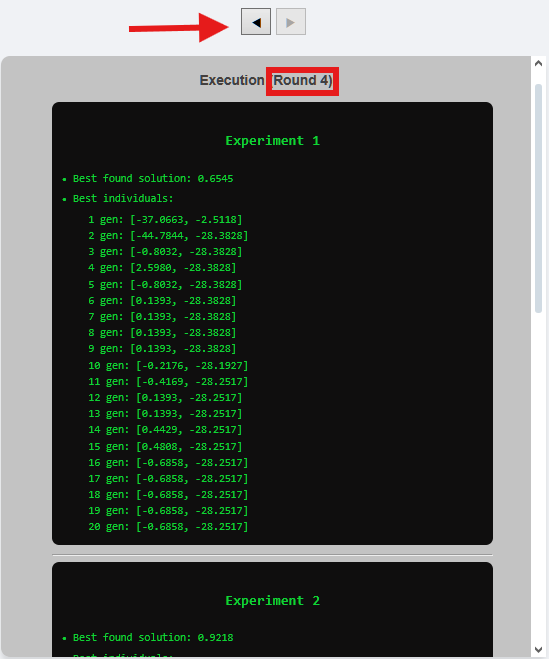
Multi-Round Navigation and Accumulation#
When the checkbox Keep Graph is selected (available in the control section above the first chart), the platform preserves a history of previous rounds. This enables the user to browse the best individuals and solutions for each round executed in the current session.
Navigation is made possible using the arrow buttons at the top of the container, allowing a seamless review of the evolutionary process across multiple rounds.
Important
If the user unchecks the Keep Graph option before running the algorithm again, all previously accumulated results from earlier rounds will be lost. Therefore, it is highly recommended to keep the option selected if you wish to analyze the evolution across rounds.